Yalantis has released several apps with audio recording functionality. Halaa – Instagram for voice and video is the latest example of our work with audio technologies. Every time we want to add some cool visualization for music, however, we have to deal with a lot of issues.
First, there are no simple and convenient Android libraries for analyzing audio files. Admittedly, there are some pretty good sound processing libraries available such as TarsosDSP, Sound Powered, FFmpeg, and others. But they are all huge and complicated to work with, especially for those who don't have any experience with sound theory.
Second, to produce smooth animations, audio should be analyzed and rendered rather quickly. While there are open source solutions that enable fast rendering, these solutions tend to address only a few aspects of sound animation, not all of them.
Read also: How to Create Mobile UI Animations That Meet Users’ Needs
During our research at Yalantis, we came across three solutions that caught our eye. Even though these solutions didn’t give us exactly the analysis and visualization capabilities we were looking for, they showed us examples of what we could improve upon.
Why these 3 libraries don’t provide an adequate solution for sound visualization
1. WaveInApp
Offering cute animations, WaveInApp generates smooth waves to visualize sound. This solution is implemented with OpenGL, so there are no issues with performance. But the downside of this library is that it’s based on the native Android Visualiser. This means you cannot connect the animations to live microphone input. In other words, there is no way you can make use of this library during audio recording.
2. AudioVisualizer
The AudioVisualizer is another music visualizer, a library that provides a large variety of visual effects, but has the same disadvantages as CRAudioVisualizationView. Additionally, all of its effects are a bit old-school and give you the unpleasant feeling that you’re using Windows Media Player.
3. VisualAudio
At last, someone who provides their own sound analysis! But on the other hand, visualization capabilities offered by this library are pretty basic, showing only the sound spectrum. This library almost looks as if it were published as a tutorial for those wanting to work with FFT.
Horizon: a Library That Visualizes Sound Quickly and Beautifully
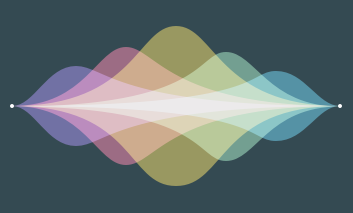
We decided to create our audio visualizeras the base for our audio projects. We wanted a solution that will work as the Android music visualizer. The result was this awesome equalizer concept that we called Horizon. You can check out Horizon on Dribbble and Github.
Horizon proves that Android can actually be great with audio, despite prevailing opinions. There is a lack of Android libraries for sound visualization, and we decided to fix it with our solution.
We had two main goals for our Horizon library:
1) excellent performance
2) excellent graphics.
Performance
There aren’t many ways to significantly improve performance for an Android app. The first issue we had to tackle was calculation. The audio spectrum is essential for music track visualization. To analyze the audio spectrum and apply it to the view you need to do a lot of math, and you need to do it fast.
We implemented most of our sound analysis in C++. This language reduces the time required to fetch the spectrum of sounds. While most of our analysis code was written in C++, we still did minor calculations in Java to make our component easy to customize.
Drawing
The design of Horizon reminds us of a beautiful sunset over the sea. This is the reason we called our library Horizon (and also because we like the band Bring Me the Horizon). Colors and shapes in our component had to be juicy and bright. That’s why we needed to implement proper blending. Also, we had to draw all curves as fast as possible. We implemented drawing using OpenGL to create a smooth user experience.
Read also: How to Create an App Design That Works
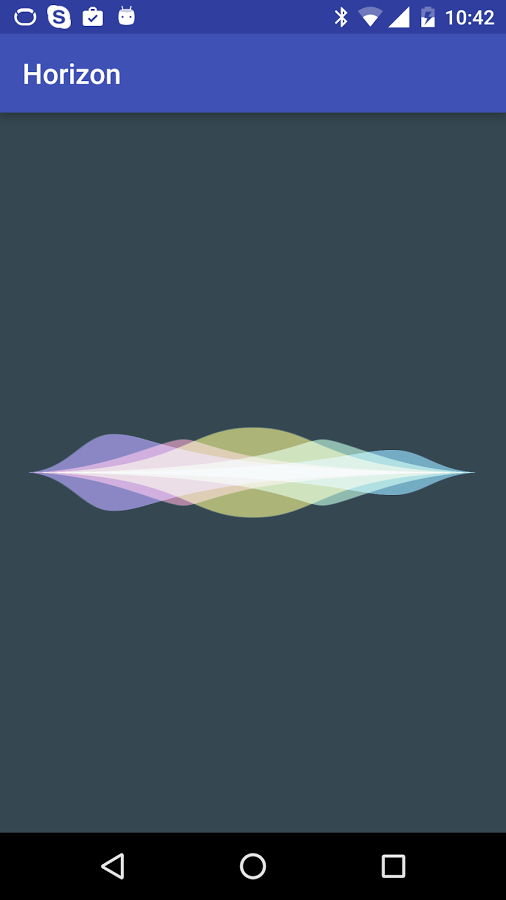
Horizon is a cute component that shows proportions of sound frequency for a specific chunk of audio data.
You can see Horizon in action on this video:
We want to thank Zagreb and Igor Muzyka, our iOS developer who are part of the Zagreb music band for letting us play some chords with Horizon.
We were very excited to take on this project. Here’s how it went.
The visual part
First, let’s introduce the visual part of our audio component. The equalizer consists of five waves. Here’s the second wave, which corresponds to bass frequencies, as an example:
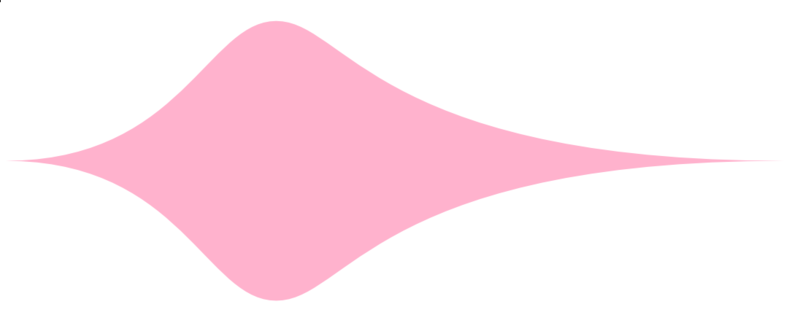
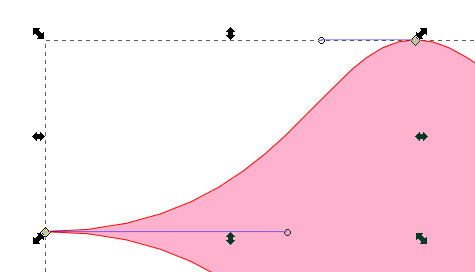
If you open the original .svg file in a vector image editor, you’ll see that this wave is made of four cubic Bezier curves! Here’s one such curve selected:
Cool, but what is a Bezier curve?
What Bezier curves are and why they rock
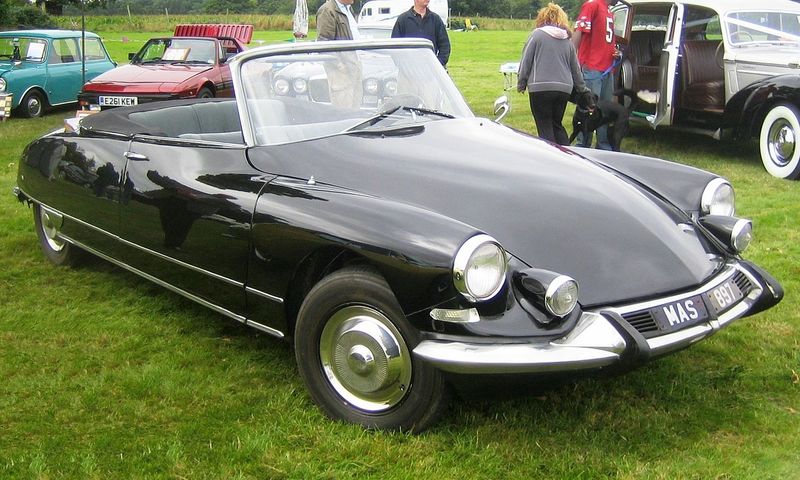
A Bezier curve describes smooth curves mathematically. Bezier curves were popularized, but not actually discovered, by Pierre Bezier. He used them to design automobile bodies. Remember those curvy cars that were popular in '60s?
Nowadays, Bezier curves are widely used in computer graphics, animations, fonts, and much more. Every modern vector graphics editor, such as Sketch and Inkscape, supports them.
The best way to understand Bezier curves is to look at some graphs. There are several types of Bezier curves:
Linear Bezier is just a linear interpolation between a start point P0P0 and an end point P1P1. It has no control point.
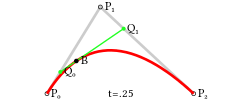
Quadratic Bezier has two control points. The form of a quadratic Bezier curve is specified by a single control point P1P1.
At every t∈[0;1]t∈[0;1] the position of Q0Q0 needs to be calculated by interpolating between P0P0 and P1P1. Then, in the same way, the position of Q1Q1 is interpolated between P1P1 and P2P2. Finally, the position of the point BB that lies on curve is interpolated between Q0Q0 and Q1Q1.
Cubic Bezier is the most popular kind and is the one we’ll be using. A cubic Bezier curve needs two control points, P1P1 and P2P2, which allows for greater flexibility:
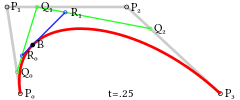
It’s drawn exactly like the other, only it involves more steps and points:
Higher order Bezier curves exist, but we are not going to look at them for the purposes of this article.
How to draw a Bezier curve on Android
Let’s start with Android Canvas and then move to an OpenGL ES solution.
How to draw a Bezier curve with Canvas
It’s possible to draw Bezier curves with Android Canvas. First, initialize paint and path. Then, add the Bezier curve to the path by calling the quadTo or cubitTo method:
 path.reset();
 path.moveTo(p0x, p0y);
 path.quadTo(p1x, p1y, p2x, p2y);
 path.moveTo(p0x, p0y);
 path.close();
And finally, draw the path on the canvas:
canvas.drawPath(path, paint);
As you can see, drawing Bezier curves with Android Canvas is very easy, but performance generally very poor:
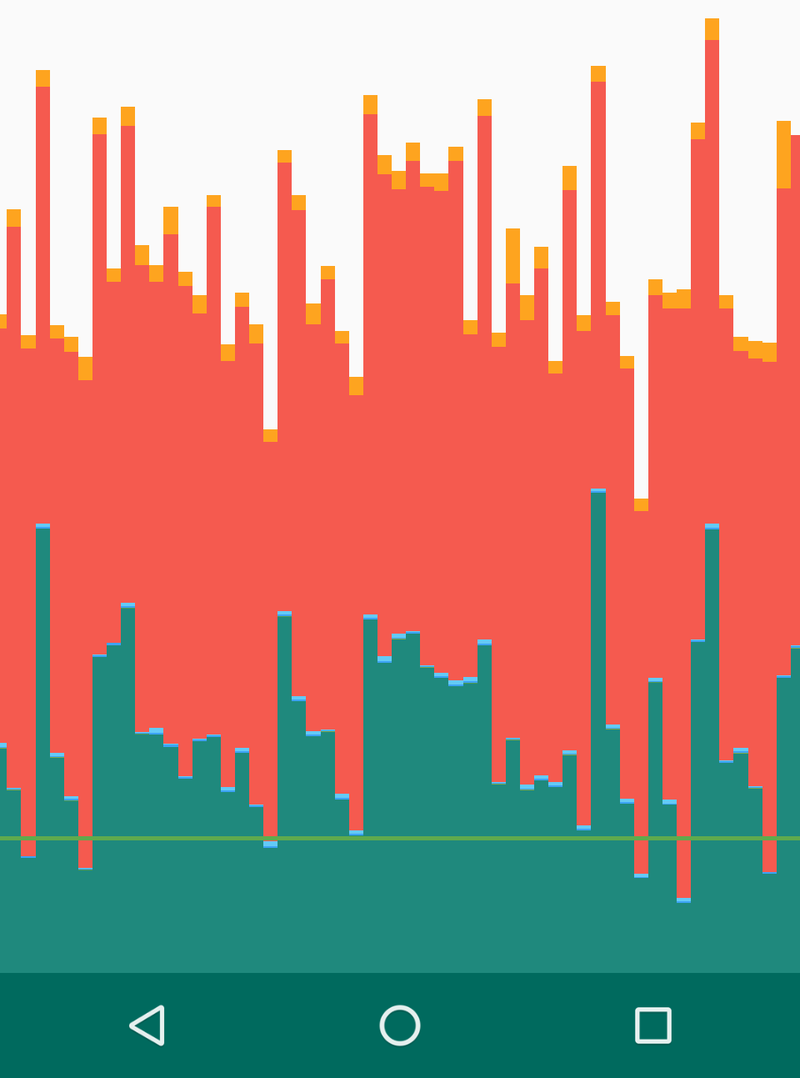
Performance while drawing multiple Bezier curves per second with Canvas. Green line signifies 16ms.
Now let’s see how the OpenGL API can help us create a Bezier curve.
How to draw a cubic Bezier with OpenGL ES
OpenGL ES is very fast at drawing triangles, which means we need to come up with a way to split the shape we want into triangles. Since our wave is convex, we can approximate it by drawing many triangles, all of which have one vertex located at the center of the screen (0, 0).
Here’s the idea:
- Split every Bezier curve into an even number of points nn
- Generate n−1n−1 triangles with vertices at (N1,N2,O), (N2,N3,O), …, (Nn−1,Nn,O).
- Fill these triangles with color.
Splitting the Bezier curve
For each point on the Bezier curve, we are going to generate three attributes for three vertices. This is done with a simple method:
private float[] genTData() {
   //  1---2
   //  | /
   //  3
   float[] tData = new float[Const.POINTS_PER_TRIANGLE * Const.T_DATA_SIZE * mBezierRenderer.numberOfPoints];

   for (int i = 0; i < tData.length; i += Const.POINTS_PER_TRIANGLE) {
       float t = (float) i / (float)tData.length;
       float t1 = (float) (i + 3) / (float)tData.length;

       tData[i] = t;
       tData[i+1] = t1;
       tData[i+2] = -1;
   }

   return tData;
}
Attributes of the first two vertices specify points on the curve. The attribute for the third vertex is always -1, which by our convention means that this vertex is located at (0,0)(0,0).
Next, we need to pass this data to a shader.
Shader pipeline
There are three types of variables in the OpenGL Shading Language:
- uniform – Data are the same for all vertices. Here we would store Bezier start, end, and control points as well as color and sound level for every wave.
- attribute – Data differ for each vertex. That’s what we’re going to use to specify point position on the curve.
- varying – We’ll use this to pass information from the vertex shader to the fragment shader indicating whether the current fragment (pixel) is near the wave’s edge.
We’ll to use the following variables:
Uniforms (common for the entire wave):
- vec4 u_Color – Color of the wave
- float u_Amp – Sound level of the wave
- vec4 u_BzData – Start and end points of the Bezier curve
- vec4 u_BzDataCtrl – Two control points of the Bezier curve
Attribute (per individual vertex):
- float a_Tdata – interpolation coefficient tt (specifies point on the curve)
Now, given the start, end, and control points of a curve, as well as tt, we need to find the location of the point on the curve.
Let’s look at the formula for a cubic Bezier:
![]()
Yikes! Not very intuitive, is it? Still, it’s easy to translate this directly into GLSL:
vec2 b3_translation( in vec2 p0, in vec2 p1, in vec2 p2, in vec2 p3, in float t )
{
   float tt = (1.0 - t) * (1.0 - t);

   return tt * (1.0 - t) * p0 +
       3.0 * t * tt * p1 +
                3.0 * t * t * (1.0 - t) * p2 +
                t * t * t * p3;
}
But we can do better. Let’s look at the geometric explanation of a cubic Bezier curve once more:
With the help of GLSL’s mix function, we interpolate between points and almost program declaratively:
vec2 b3_mix( in vec2 p0, in vec2 p1,
         in vec2 p2, in vec2 p3,
 in float t )
{
   vec2 q0 = mix(p0, p1, t);
   vec2 q1 = mix(p1, p2, t);
   vec2 q2 = mix(p2, p3, t);

   vec2 r0 = mix(q0, q1, t);
   vec2 r1 = mix(q1, q2, t);

   return mix(r0, r1, t);
}
This alternative is much easier to read and, we think, is equivalent in terms of speed.
Color blending
Take another look at how nicely the colors blend together in our original design. For, instance on the left the purple and reddish waves blend into a soft pink, and along the x axis all five waves merge into a whitish color.
This is called additive coloring. It’s similar to the way light mixes in computer monitors:

Additive coloring
By a little trial and error, we found out that this particular color blend mode is called the screen blend mode.
To tell OpenGL that we want screen-like blending, we need to enable GL_BLEND and specify the blend function in our onDrawFrame method before actually drawing the waves:
GLES20.glEnable(GLES20.GL_BLEND);
GLES20.glBlendFuncSeparate(
       GLES20.GL_ONE, GLES20.GL_ONE_MINUS_SRC_COLOR,
       GLES20.GL_ONE, GLES20.GL_ONE_MINUS_SRC_ALPHA
); // Screen blend mode
The end result is:
How can you add Horizon to your project?
To add Horizon to your project you need to follow these three easy steps:
1) Include the library as a local library project:
compile 'com.yalantis:eqwaves:1.0'
2) Initialize the Horizon object with params referring to your sound:
mHorizon = new Horizon(glSurfaceView, getResources().getColor(R.color.background),
                   RECORDER_SAMPLE_RATE, RECORDER_CHANNELS, RECORDER_ENCODING_BIT);
3) To update view, call the updateView method with a chunk of sound data to be proceeded:
byte[] buffer = new byte[bufferSize];
  //here we send some sound data to the buffer
  mHorizon.updateView(buffer);
Enjoy the Horizon!
Ten articles before and after
Using Machine Learning Algorithm for Predicting House Valuations
Integrating SiriKit in a Third-Party iOS App
How to Use the Android NDK When Writing an App in Kotlin
What You Can Create with FFmpeg Filters and Frei0r Plugin Effects
API Versioning: Which Gem to Pick for API Versioning on Ruby on Rails
How We Created uCrop, Our Own Image Cropping Library for Android
Introducing uCrop, Our Own Image Cropping Library for Android
Here’s how the cybercriminal underground has reacted…